Palisade: from histograms to results
Palisade is a powerful tool for processing ROOT files containing analysis-level objects such as histograms and profile histograms. In particular, it can be used to further process and refine the ROOT files produced by Lumberjack.
Palisade offers:
a simple Pythonic interface for retrieving objects from ROOT files
in-memory caching of retrieved objects to minimize unnecessary disk access
the ability to perform operations involving the retrieved objects, ranging from simple arithmetic to arbitrary user-supplied Python code
tools for defining parameterized tasks involving these operations
the ability to dispatch parameterized tasks on user-defined multidimensional parameter spaces
a flexible command-line interface for running tasks
a modular structure allowing for easy extension of the existing interfaces and structures to cover custom use-cases
Note
This chapter is still a work in progress, so some information may be missing. When in doubt, make sure to also check the API documentation.
Processors
Palisade is a Python module that offers a number of different processors (currently only two), each designed for a particular type of task. A processor is initialized with a configuration (in the form of a Python dictionary) and an output directory for writing any output files generated by the task.
Running Palisade is as straightforward as importing the processor
object, instantiating it with a particular configuration and executing
the run method:
# import a processing module from Palisade (e.g. AnalyzeProcessor)
from Palisade import AnalyzeProcessor

# create a configuration dictionary for the processor
my_configuration = {
   ...
}

# instantiate the processor with the configuration and an output directory
my_processor = AnalyzeProcessor(my_configuration, output_folder='/path/to/output/directory')

# run the processor
my_processor.run()

# the resulting files will be in the specified output directory
The exact behavior of the processor depends entirely on the content of the configuration dictionary. The structure of the configuration is covered in the following sections.
Simple tasks
One of the basic use-cases for Palisade involves extracting objects
from an input ROOT file, processing them, and saving the result to an
output ROOT file. This functionality is provided by a dedicated
processor: the AnalyzeProcessor.
The simplest task that can be configured involves extracting a single object and copying it to the output ROOT file (possibly under a different path or name). The following example configuration shows how to achieve this:
{

  # register input file path under the nickname 'my_file'
  'input_files' : {
    'my_file': "/path/to/input_file.root",
  },

  # declare task for copying object
  'tasks' : [
    {
      'expression': '"my_file:path/to/input_object"',  # object path in input ROOT file
      'filename': "/path/to/output_file.root",         # will be created
      'output_path': "path/to/my_output_object",       # path in output ROOT file
    }
  ]

}
Running AnalyzeProcessor
with the above configuration will create a ROOT file at /path/to/output_file.root
and copy the object found inside the input ROOT file /path/to/input_file.root
under the path path/to/input_object to the output file under the output file
path/to/my_output_object.
The task dictionary given under tasks can contain the following keys:
Key |
Description |
|---|---|
Mandatory keys: |
|
filename |
name of the output file to which the output object will be written. Can contain placeholders for context-sensitive replacement (see below for more information). |
expression |
a string which contains a Python expression returning the object to be written to the file. (see below for more information on expressions) |
output_path |
path to the output object inside the output ROOT file. |
Optional keys: |
|
x_label |
the label to use for the x axis. If not given or |
y_label |
the label to use for the y axis. If not given or |
title |
the title to use for the output ROOT object. If not given or |
The above configuration will only copy a single object to the output
ROOT file. If multiple objects should be copied in a single processor
run, additional dictionaries can be added to the tasks list
accordingly.
As the number of objects grows, specifying this list explicitly can become tedious and error prone and lead to an overloaded configuration. Palisade provides a templating mechanism to avoid this. It is covered in the next section.
Templates and Expansions
One of the more powerful features of Palisade is the ability to define tasks using placeholders for certain bits of information instead of “hard-coding” them in the task definition.
These so-called task templates will then be dispatched over a number of expansions contexts (expansions for short), which contain the actual information.
Each defined task template will then be run for each expansion context, replacing all placeholders with their values, as specified in the expansion definition.
Below is an example for a full Palisade configuration that does the same thing as the simple task configuration in the previous section, but this time using a task template dispatched over a single expansion context.
{

  # register input file path under the nickname 'my_file'
  'input_files' : {
    'my_file': "/path/to/input_file.root",
  },

  # declare task for copying object
  'tasks' : [
    {
      'expression': '"my_file:{object[input_path]}"',      # path taken from expansion context 'object'
      'filename': "/path/to/output_file.root",
      'output_path': ContextValue('object[output_path]'),  # another way to do this
    }
  ]

  # define expansion contexts
  'expansions' : {

    # define an expansion namespace containing object-specific information
    'object' : [

      # define only one expansion, since we only want to copy a single object
      {
        'input_path': 'path/to/input_object',
        'output_path': 'path/to/my_output_object'
      }
    ]
  }

}
In the above configuration, the object paths are no longer “hard-coded”
in the task definition. Instead, the tasks specifications
used placeholders to indicate that the information should
come from an expansion context. These contexts are then defined under
a separate configuration key, expansions. This is be explained
in more detail below.
Expansion definition
The structure of expansion contexts over which a task template should be
dispatched is given by a dictionary provided in the expansions
configuration key. The keys of this dictionary are the so-called expansion
namespaces, each of which maps to a list of expansion contexts. Each
expansion context within a namespace is a dictionary that stores information in
the form of key–value pairs.
In the above example, only one expansion namespace (object)
is needed. Each context in this namespace contains the information needed
to copy an object from an input path to an output path. This is
represented in the context by two corresponding string-valued keys.
# expansion definition
'expansions' : {

  # define an expansion namespace which contains object-specific information
  'object' : [

    # only one expansion context, since we only want to copy a single object
    {
      # need only two expansion keys (this is all the information required by the task)
      'input_path': 'path/to/input_object',
      'output_path': 'path/to/my_output_object'
    }

    # additional contexts can be added as needed
  ]
}
Note
The name of the expansion namespace (object in this case) and the
keys in the expansion context (input_path, output_path)
do not have any special meaning and can be chosen arbitrarily. The only requirement
is that any keys used in placeholders in task templates are also defined
in the corresponding expansion contexts.
Placeholders
There are two ways to indicate that the values of task parameters should
be taken from the current expansion context: placeholders in strings
and the ContextValue configuration helper class.
A placeholder is any part of a string between curly braces ({}).
The placeholder itself consists of the name of the expansion
namespace followed by the key of the information to be inserted, in
brackets ([]). This is the same syntax used by Python for
string interpolation using format.
Note
Placeholder replacement is performed on all strings inside
a task definition. To avoid interpreting curly braces as placeholder
syntax, they can be escaped by doubling them. Alternatively, the
string can be wrapped in the configuration helper class
String, which will disable placeholder
replacement for that string.
Another way to indicate that the value of a task parameter should be
taken from the current expansion context is by using the configuration
helper class ContextValue.
It takes a string indicating the expansion namespace and the key
using the same syntax as in string placeholders (the part between
curly braces). Note that the braces themselves ({}) are not
needed when using ContextValue.
All ContextValue objects are resolved to the
corresponding values when the task is dispatched over the expansion
contexts.
Note
One crucial difference between using
ContextValue('context[key]') and placeholders like
"{context[key]}" is that the former will expand to
a value of the same type as context[key], while
the latter will always attempt to coerce that value to a string,
regardless of the type of context[key].
Advanced use of ContextValue
The value of a context-sensitive task parameter does not necessarily
have to be set using a single ContextValue object,
but can also be an expression involving several ContextValue
objects. Expressions can involve arithmetic or string formatting operations
and will stay unevaluated until the ContextValue
objects are resolved.
Note
When using ContextValue in an expression,
placeholder replacement is disabled and all strings involved
are considered literal strings. To perform placeholder,
replacement in this case, ContextValue
has to be used consistently.
ContextValue objects directly support all basic
arithmetic operations (+, -, *, /, //), as well as
logical operations (and, or, xor). These can be chained an
arbitrary number of times. For example, the following configuration entry
will be replaced by three times the sum of the values corresponding to
key_1 and key_2 in the namespace values:
'result' : 3 * (ContextValue('values[key_1]') + ContextValue('values[key_2]'))
The above will resolve correctly as long as the corresponding values support the addition and multiplication operations. If the values are incompatible, an error will be raised at runtime when the context values are resolved.
ContextValue objects may also be used as replacement values
in a formatted string. For this, the string needs to be wrapped inside the
String configuration helper class, which provides a
format method analogous to Python’s built-in
str.format().
'result' : String("The value for 'key_1' is: {}").format(ContextValue('values[key_1]'))
It is even possible to use context-sensitive formatted strings as keys for other context value
lookups. Assuming the key meta_key maps to the string 'key_1', the following
configurations would yield the same result:
'result' : ContextValue(String("values[{}]").format(ContextValue('values[meta_key]')))

'result' : ContextValue('values[key_1]')
Expressions involving ContextValue objects can represent arbitrarily
complicated evaluation-time control flows thanks to a series of configuration helper objects
like If and Try.
# choose between two keys depending on the value of a third key
'result' : If(ContextValue('values[a_key_available]'), ContextValue('values[a_key]'), ContextValue('values[other_key]'))

# choose a key if it is available, falling back to another key if it does not exist
'result' : Try(ContextValue('values[possibly_missing_key]'), KeyError, ContextValue('values[alternative_key]'))
Context-dependent access to analysis-level objects is provided by the InputValue
configuration helper class. At evaluation time, it will be replaced by an arbitrary expression involving
analysis-level objects (see below for more information on these expressions). This is particularly useful
when annotating plots, since it provides a way to display information extracted from analysis-level objects.
Note
While many Python syntax elements will work seamlessly with ContextValue, some
in particular do not. Some examples of these incompatible elements are listed here.
along with suggested workarounds.
the ternary operator (i.e.
value if condition else other). If this is needed, use theIfconfiguration helper instead.the in operator. If this is needed, use the
ContextValue.__contains__special method instead. Note that the logic is reversed with respect toin.passing
ContextValueexpressions tostr.format. As noted above, wrap the string in the configuration helper classStringto do context-dependent string formatting.comparisons with multiple operators. Statements like
a < val <= bwherevalis aContextValuewill not work as expected and will not raise an exception. As a workaround, replace by an expression using single comparisons, i.e.(a < val) and (val <= b).
Multidimensional expansions
The advantage of working with task templates and expansions becomes evident for tasks that need to be dispatched over a multidimensional parameter space.
In Palisade, this is achieved by specifying multiple context namespaces, as shown in the following example:
'expansions' : {

  'namespace_A' : [
    context_A1,  # context dictionaries containing key-value pairs
    context_A2,
    context_A3,
  ],

  'namespace_B' : [
    context_B1,  # context dictionaries containing other key-value pairs
    context_B2,
  ]

}
Given the expansion definition above, each defined task is run once for every combination of contexts from the two namespaces, resulting in a total of six (3*2) concrete tasks (or “jobs”) being run for each task template:
{'namespace_A' : context_A1, 'namespace_B' : context_B1}  # job 1
{'namespace_A' : context_A1, 'namespace_B' : context_B2}  # job 2
{'namespace_A' : context_A2, 'namespace_B' : context_B1}  # job 3
{'namespace_A' : context_A2, 'namespace_B' : context_B2}  # job 4
{'namespace_A' : context_A3, 'namespace_B' : context_B1}  # job 5
{'namespace_A' : context_A3, 'namespace_B' : context_B2}  # job 6
The “space” of expansion contexts thus corresponds to the outer product of all specified expansion namespaces.
Operations on analysis-level objects
The above examples were constructed mostly based on the use-case of simply copying objects from an input file to an output file. However, most real-world tasks involve applying a series of operations on input objects and storing the results.
In Palisade, arbitrary expressions involving input objects can be specified
as strings in expression key of a task.
When the task is run, the output object is obtained by evaluating the
expression as if it were a regular Python expression (with some
limitations).
The main difference is that all literal strings in the expression are interpreted as object specifications and are replaced by the objects they refer to during the expression evaluation.
Note
The objects read in this way from the input ROOT file are not the native
ROOT (PyROOT) objects directly, but are always wrapped in the corresponding
rootpy class. This is because rootpy provides a more
Pythonic interface for interacting with ROOT objects. In particular,
it directly supports basic arithmetic operations on histograms and similar
object out-of-the box, enabling users to write simple expressions like
2 * <object> to scale an object by a factor of two or
<object_1> / <object_2> to perform histogram division.
For more details on expression evaluation, consult the API documentation for
the InputROOT object, and its
get_expr method in particular.
The following example task configuration will compute the ratio of two histograms:
# declare task for histogram division
'tasks' : [
  {
    'expression': '"my_file:numerator_histogram" / "my_file:denominator_histogram"',
    'filename': "output_file.root",
    'output_path': "ratio_histogram",
  }
]
User-defined operations
For complex tasks, basic arithmetic operations are not always sufficient. Palisade allows users to write custom Python functions and register them for use in expressions.
To register a function in this way, the
Palisade.InputROOT.add_function is used:
from Palisade import InputROOT

@InputROOT.add_function
def my_operation(rootpy_object):
    '''Do something for each bin.'''

    for _bin in rootpy_object:
        _bin.value = do_something(_bin.value)

    return rootpy_object
The function can then be used in expressions by simply calling it:
my_operation("my_file:my_object").
To register a function under a different name, use the name
keyword argument:
@InputROOT.add_function(name='short_name')
def very_long_fuction_name_we_do_not_want_to_use_in_expressions(rootpy_object):
    '''Do something for each bin.'''

    ...
To override a function that has already been registered, pass
override=True to the add_function decorator.
@InputROOT.add_function(override=True)
def my_operation(rootpy_object):
    '''Do something else for each bin.'''

    for _bin in rootpy_object:
        _bin.value = do_something_else(_bin.value)

    return rootpy_object
A function imported from another package can be registered by calling
add_function directly:
from my_package import my_function

InputROOT.add_function(my_function)
To obtain a function that has already been registered, use the
get_function method:
@InputROOT.add_function
def my_tweaked_operation(rootpy_object):
    '''Do something tweaked for each bin.'''

    # apply already-registered function to object
    original_function = InputROOT.get_function('my_original_operation')
    rootpy_object = original_function(rootpy_object)

    # tweak result

    return rootpy_object
Plotting using matplotlib
Plotting is a ubiquitous task in high-energy physics workflows. Palisade
provides a dedicated processor for this purpose: the
PlotProcessor. This processor uses matplotlib
to generate graphical representations (“plots”) of analysis-level objects
stored in ROOT files and provides many configuration options to fine-tune
the resulting plots.
The configuration structure for this processor is similar to the
one for the AnalyzeProcessor. The only difference
is that the tasks configuration key is replaced by the
figures key.
As the name suggests, each dictionary under figures represents a
single figure (i.e. one image) or figure template, if used together with the
expansions key. Furthermore, each figure can contain
multiple subplots, allowing multiple objects to be plotted to the
same figure.
The following example shows the minimal configuration for plotting an object contained in a ROOT file:
{
  # declare input files
  'input_files' : {
    'my_file' : "/path/to/input_file.root"
  },

  'figures' : [

    # define a figure
    {
      # output file name (extension defines file type)
      'filename': 'example_plot_1.png',

      # list of subplots (one dict per subplot)
      'subplots': [

        # plot object 'my_object' from 'my_file'
        {
          'expression' : '"my_file:path/to/my_object"'
        }
      ]
    }
  ]
}
This will generate a file example_plot_1.png containing a plot of
the object specified in the expression key. An example of
the output is shown in the figure below.
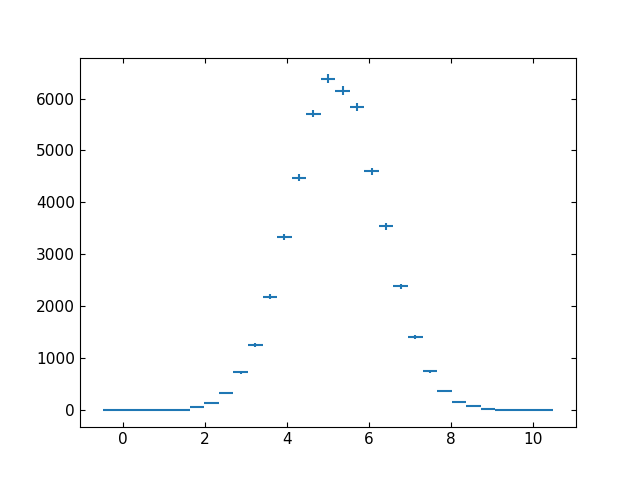
Example plot showing the default output created by the
PlotProcessor. Other elements such as axis labels,
line colors or marker shapes can be customized by providing the corresponding
keyword arguments.
Plots created using the minimal configuration will use a simple plot style by default and will be missing some important information such as axis labels or a legend. To add this information to the plots or to customize the plotting style, additional keys can be specified in the plot configurations.
The sections below describe the different portions of the
PlotProcessor configuration.
Creating figures
The basic unit of work for the PlotProcessor is the the figure. Figures
(or figure templates when using context-sensitive replacement) are specified in
the top-level configuration key figures. The key contains a list of
dictionaries, each representing a figure or figure template.
Each figure dictionary must contain the following keys:
Key |
Description |
|---|---|
Mandatory keys: |
|
filename |
name of the file to be written out by the task. Can contain placeholders for context-sensitive replacement. The format of the output image (JPEG, PNG, PDF…) will be determined automatically by matplotlib based on the filename extension. Note Writing out the same image in different formats is not directly supported, although it can be achieved by using a placeholder in place of a file extension and putting all desired extensions inside an expansion namespace. (see above) |
subplots |
list of dictionaries, each containing a plot configuration. (see below) Note In Palisade, the term “subplot” simply refers to the graphical representations of an analysis-level object. This is different from matplotlib terminology, where “subplots” instead refers to the different coordinate axes in a figure, which are called “pads” in Palisade. |
Optional keys: |
|
dump_yaml |
boolean. If The YAML file will contain both the plot configuration (after performing context-sensitive replacement) and will include a numerical representation of all plotted objects. |
figsize |
tuple of two floats indicating image width, height in inches. |
pads |
list of dictionaries, each containing a pad configuration (see below) |
pad_spec |
a dictionary with keywords for customizing the layout of pads contained in the figure (see below) |
texts |
list of dictionaries containing the specification of text elements to shown on the figure. (see below) |
text_output |
boolean. If The text file will contain less information than the YAML file output
by Warning This keyword is deprecated and should be replaced with dump_yaml. |
upper_label |
text to be printed in the upper-right corner of the figure, above the uppermost pad |
Configuring the plots
For every dictionary in subplots, Palisade will issue a call
to a matplotlib method, which will perform the actual plotting.
The name of the plot method can be specified via the plot_method
keyword. Note that this must be a valid method of the
matplotlib.Axes object. If plot_method is not given,
errorbar is chosen as a default.
Various other behaviors and plot styles can be controlled by specifying additional keyword arguments. They are listed in the following overview:
Key |
Description |
Default |
|---|---|---|
Mandatory keys: |
||
expression |
a string which contains a Python expression returning the object to be plotted. The expression is evaluated in the same way as for the
|
|
Optional keys: |
||
label |
a string containing a label for this plot. The label
will be shown in the legend next to the legend handle.
If Note If plots have identical labels, only one legend entry will be created. All corresponding legend handles will be superimposed. |
|
marker_style |
If If |
|
mask_zero_errors |
if |
|
pad |
index of the pad in pads to which the subplot will be plotted |
|
plot_method |
name of the matplotlib method to use for plotting.
Should be a valid method of
a |
|
stack |
subplots with the same stack are stacked on top of
each other. If |
|
color, linestyle, … |
all other keyword arguments are passed to the matplotlib plot method |
… |
Any additional keywords not listed in the above table are passed on to the matplotlib method. This allows users nearly complete access to the matplotlib API.
In addition to the standard matplotlib keywords, Palisade implements some additional functionality for specific plot methods which can be accessed via the following method-specific keywords:
Key |
Description |
Default |
|---|---|---|
label_bins_with_content
(only for |
boolean. If |
|
bin_label_format
(only for |
Python format string (with braces) or callable.
If label_bins_with_content is |
|
bin_label_color
(only for |
string indicating a matplotlib color. If
label_bins_with_content is |
|
norm
(only for |
colormap normalization
object (must inherit from
|
|
Plotting to multiple pads
Sometimes multiple plot pads are needed. A typical use-case for this is to show the ratio(s) of two or more objects together with the objects themselves in the same figure.
To create multiple pads, two keyword arguments are provided: pads
and pad_spec. The former contains a list of pad configuration
dictionaries (one pad is created per dictionary), while the latter controls
the pad layout (margins, spacings, etc.).
Pad configuration dictionaries in pads can specify the following
optional keys:
Key |
Description |
|---|---|
axvlines, axhlines |
list of floats (or dictionaries) specifying the values at which to draw vertical or horizontal lines that traverse the entire pad. If dictionaries are given instead of floats,
they must each contain a list of floats under the key
For example, the following can be used for drawing two thick red lines horizontal lines at y=0 and y=1: 'axhlines' : [
{
'values' : [0, 1],
'linewidth' : 5,
'color' : 'red'
}
]
|
height_share |
float indicating the share of the total plot height. The pad will take up a fraction of the plot height corresponding to the ratio of this value to the sum of the height_share values of all pads. |
legend_additional_entries |
list of dictionaries specifying additional entries
to show in the legend. The dictionaries must contain
a legend handle under the key The The The For example, the following will add a dummy legend entry
at the top of the legend, consisting of the string
'legend_additional_entries' : [
  {
    'handle' : "Symbol",
    'position' : 0
  },
  {
    'handle' : Rectangle((0, 0), 1, 1, fc='red'),
    'label' : "My Patch",
    'position' : -1
  }
]
|
legend_kwargs |
a dictionary with keywords to be passed to
matplotlib’s The Palisade provides some custom handlers for common types like strings and tuples: from Palisade import LegendHandlerTuple
from Palisade import LegendHandlerString
These are used as the default handlers for their
respective types and can be customized by passing
keyword arguments to the constructors. To override the
default behavior, appropriate entries must be added to
the 'legend_kwargs' : {
'handler_map' : {
# show merged handles side by side
tuple : LegendHandlerTuple(ndivide=None, pad=4),
# use bold font for string handles
str : LegendHandlerString(fontweight='bold')
}
}
For tuples (which are used to implement merged handles,
e.g. for identical labels), the |
legend_reverse_stack_order |
bool. If |
x_label, y_label, z_label |
string to use as axis label. Can contain LaTeX-formatted
math between dollar signs ( |
x_range, y_range, z_range |
tuple for specifying the lower and upper plot bounds
the respective axis, or |
x_scale, y_scale, z_scale |
scale to use for the axis. Can be either |
z_labelpad |
offset to add between the z_label and the colorbar |
Note
Context-sensitive replacement (see
above) is also performed for the
pads configuration dictionary.
The pad_spec dictionary can be used for adjusting some
layout-specific parameters such as margins or the spacing between pads.
The following keywords are supported:
Key |
Description |
|---|---|
left, right, top, bottom |
floats indicating the area taken up by all pads, as fractions of the figure dimensions. |
wspace, hspace |
floats indicating amount of space left between pads, as a fraction of the average axis width/height |
All the above pad_spec keywords are passed to the constructor of a
matplotlib.gridspec.GridSpec object for the current axes. For more
details, consult the matplotlib documentation.
Note
At the moment, only a vertical arrangement of pads is supported. In a future
release, support for other layouts may be provided (to the extent that they
are supported by the GridSpec interface
in matplotlib).
Adding text annotations to plots
An annotation is a piece of text that refers to a particular position in the figure.
Annotations can be added to plots via the texts configuration key. It contains a
list of dictionaries, each of which specifies an annotation to be displayed on the plot.
At the very least, an annotation consists of a string text and a position xy at which it should appear in the image. The annotation can optionally be placed at a different position by additionally specifying the keyword xytext. This is typically accompanied by an arrow pointing from the annotation to the point xy.
The following table contains a summary of keywords These and other aspects of the annotation can be controlled via a number of optional keywords, which are summarized in the table below:
Key |
Description |
Default |
|---|---|---|
Mandatory keys: |
||
text |
string containing the text to be shown. Can contain
math formatted as LaTeX between dollar signs ( |
|
xy |
tuple indicating the coordinates of the point which should be annotated. This is also the position of the annotation text, unless it is overridden via the optional keyword xytext. |
|
Optional keys: |
||
annotation_clip |
bool. If |
|
arrowprops |
dictionary containing the properties of an arrow to draw between xy and xytext. (see the matplotlib documentation for more details) |
|
textcoords |
string. Indicates how to interpret coordinates given in
Can take any of the values that xycoords can as
well as the following strings: It is also possible to pass a tuple of two of the above types to indicate different coordinates for the x and y axes. Consult the matplotlib documentation for more details about the meaning of the above specifications. |
same as xycoords |
xycoords |
string. Indicates how to interpret coordinates given in
Can be one of the following strings: Can also be a callable/function or a matplotlib
It is also possible to pass a tuple of two of the above types to indicate different coordinates for the x and y axes. Consult the matplotlib documentation for more details about the meaning of the above specifications. |
|
pad |
index of the pad in pads in which the text will be plotted |
|
transform |
Warning This keyword is deprecated. Use string. Indicates how to interpret coordinates given in
If If |
|
xytext |
tuple indicating the coordinates of the annotation text (if different fron xy) |
same as xy |
color, fontsize, linestyle, … |
all other keyword arguments are passed to the
|
… |
Note
Context-sensitive replacement (see
above) is also performed for the
texts configuration dictionary. To display information extracted from analysis-level
objects in a text annotation, use the InputValue configuration
helper class.
Tasks
Todo
Finish this section.